Non-Ohmic Conductor Experiment
An experiment was carried out where the effect on the current of changing the voltage through bulb was measured. The results were plotted on graphs, which are given below. THe difference between the two graphs is in the first one the x-axis is current and in the second graph it is potential difference. It is the same data plotted on each graph.
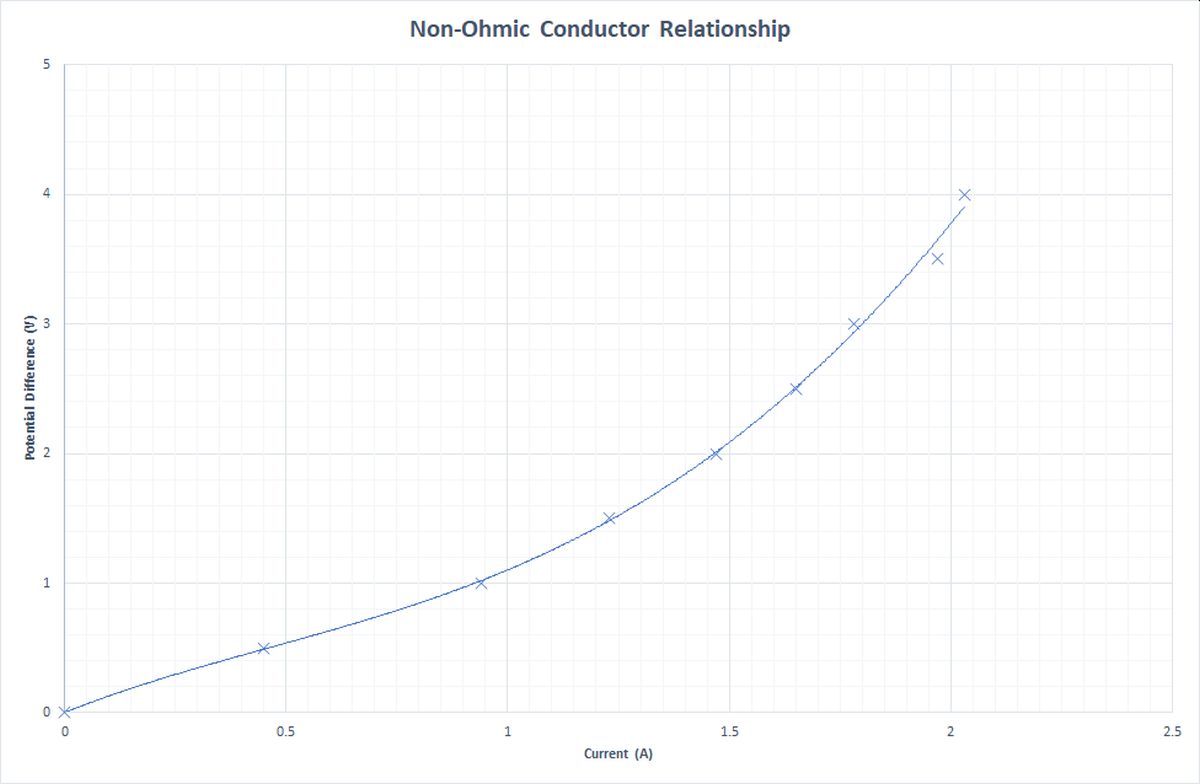
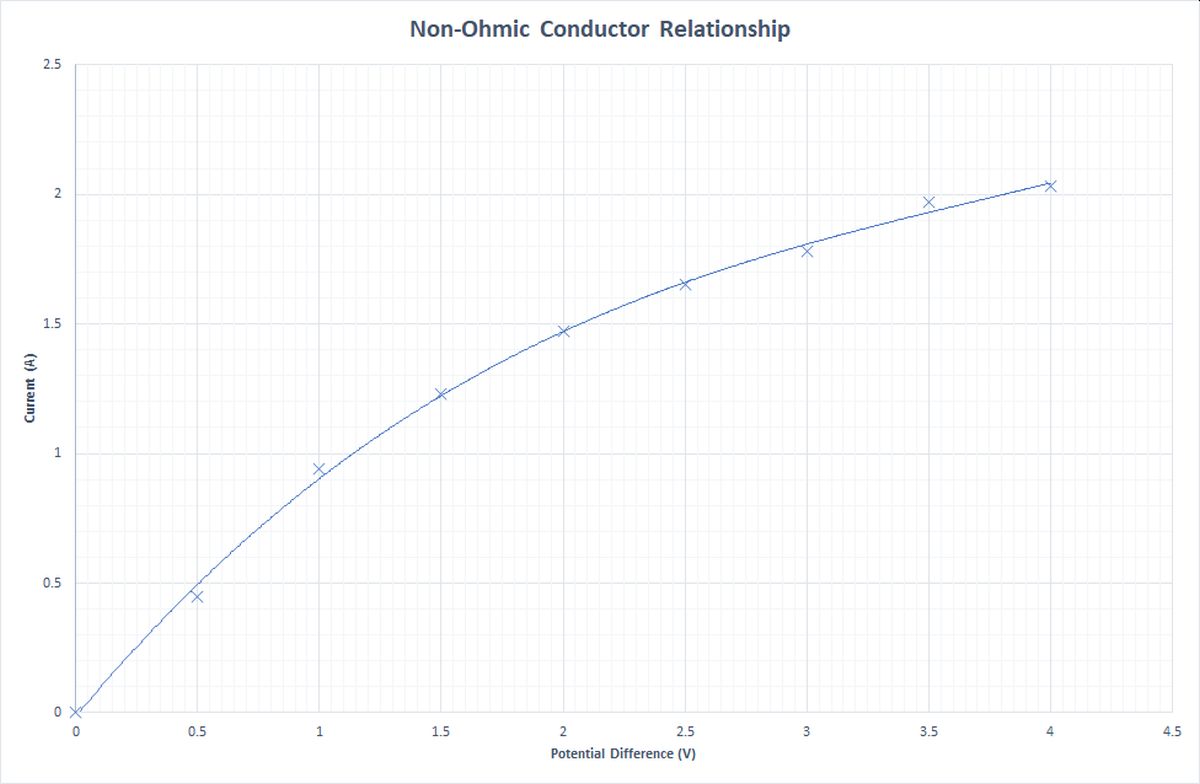
The line of best fit in both graphs is a curve. This is because the element in the bulb heats up. When it gets hotter the resistance of the wire increases. This means that as the current increases the resistance is higher. Therefore there is a lower current than expected at higher voltages.