Motion - equations and graphs
Vectors
| Vectors | Scalars |
|---|---|
| Displacement | Distance |
| Velocity | Speed |
| Acceleration | Time |
| Force | Mass |
| Momentum | Temperature |
| Electric Field | Density |
| Magnetic Field | Electric potential |
| Gravitational Field | Electric charge |
| Torque | Energy/Work |
All quantities in bold appear in the higher course.
Vector quantities have both size and direction, while scalar quantities only have size. Using displacement and distance we can look at the difference between a scalar and a vector quantity.
Displacement and distance example
Let us consider a trip from Aberdeen city centre to Edinburgh city centre.
It is a journey that takes two hours.
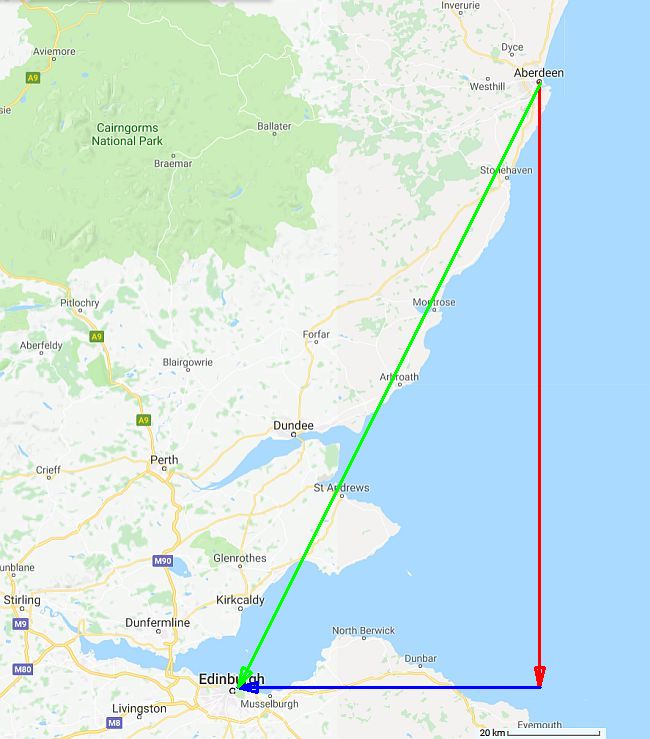
Looking at the map we can see that Edinburgh city centre is 133 km due south and 67 km due west of Aberdeen city centre.
Displacement
Displacement between the start and finish points of a journey is measured as a straight line between the two points and must include the direction of that distance.
Using pythagoras we can work out the size of the resultant vector.
s = √(1332 + 672)
s = 149 km
Displacement is a vector and so we need to work out the angle west of south, or the three figure bearing for the resultant vector.
This can be done using knowledge of trigonometry.
The angle between the resultant vector and the due sout vector is given by
tanθ = due west vector/due south vector.
tanθ = 67/133
θ = 27° west of south. Since due south is a bearing of 180, we can claculate the final bearing by adding 27° to 180 which results in a bearing of 207
(Remember that three figure bearings do not require the ° unit).
The resultant vector = 149 km on a bearing of 207.
Distance
The distance travelled includes all the twists and turns in the road and was 204 km. As you can see this is a much larger distance than the displacement.
Velocity and speed example
In the above example we can clearly see the difference between displacement and distance. What about the velocity and speed for the journey from Aberdeen city centre to Edinburgh city centre?The journey took 2 hours.
Displacement
Where:
s = 149 km on a bearing of 207 = 149 x 1000 = 149,000 m
t = 2 hours = 2 x 60 x 60 = 7,200 s
The average velocity is therefore 21 m s-1 on a bearing of 207
Speed
d = 204 km = 204 x 1000 = 204,000 m
t = 2 hours = 2 x 60 x 60 = 7,200 s
The average speed is therefore 28 m s-1
Resolving a vector into components
Consider a rail journey from Aberdeen train station to Glasgow central station. The displacement for the traveller is 195 km on a bearing of 223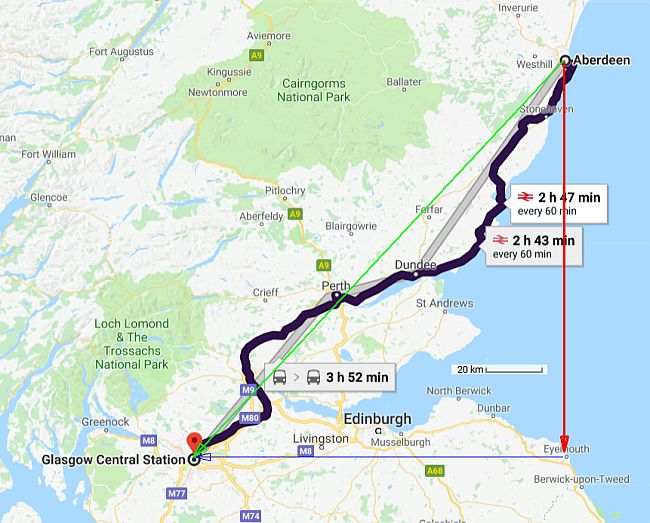
We can resolve this vector into the south pointing and west pointing vectors. In order to do this we have to specify which directions have a positive value. Very often this is to + for North or up, and + for East or to the right. Depending on the circumstances we can chose to change this as long as we make it clear to those who are reading our work.
Setting South as + and West as + this will allow us to have both of the component vectors in a positive direction.
Looking at the map we can see that the angle between the resultant vector and the due south vector is 223° - 180° or 43°.
Using trigonometic relationships we can therefore see that the components are:
due south vector = 195 cos 43° = 143 km due south
due west vector = 195 sin 43° = 133 km due west
Calculating average speed and average velocity
Attempt to solve the question yourself before clicking the solve button!
SUVAT Equations
| Quantity | Equation | Quantities |
|---|---|---|
| Distance | d = distance (m) v bar = average speed (m/s) t = time (s) |
|
| Displacement | s = displacement (m) v bar = average velovity (m/s) t = time (s) Remember to state the direction |
|
| Velocity | v = final velocity (m/s) u = initial velocity (m/s) a = acceleration (m/s2) t = time (s) Remember to state the direction |
|
| Displacement | s = displacement (m) u = initial velocity (m/s) a = acceleration (m/s2) t = time (s) Remember to state the direction |
|
| Velocity | v = final velocity (m/s) u = initial velocity (m/s) a = acceleration (m/s2) t = time (s) Remember to state the direction |
|
| Displacement | s = displacement (m) u = initial velocity (m/s) v = final velocity (m/s) t = time (s) Remember to state the direction |
Remember the SUVAT equations only work when dealing with situations where there is a constant acceleration. Otherwise calculus is required.
Calculation examples
These examples are from past paper questions in SQA Higher Physics Papers. They are copyright to the SQA, but in the public domain from their web site at: Physics Higher Past Papers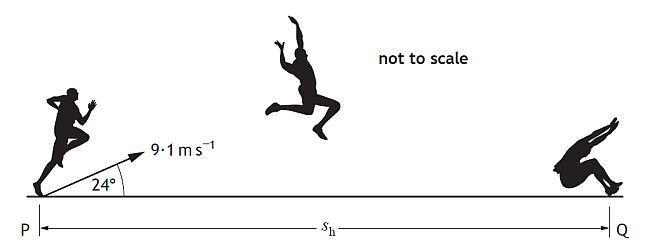
An athlete takes part in a long jump competition. The athlete takes off from point P with an initial velocity of 9.1 m s-1 at an angle of 24° to the horizontal and lands at point Q.
(a) Calculate:
(i) the vertical component of the initial velocity of the athlete;
(ii) the horizontal component of the initial velocity of the athlete.
The first step is to resolve the launch vector of 9.1 m/s at 24° into horizontal and vertical components.
(i) Vertical component = 9.1 sin 24°
Vertical component = 3.7 m/s
(ii) Horizontal component = 9.1 cos 24°
Horizontal component = 8.3 m/s
(b) Show that the time taken for the athlete to travel from P to Q is 0.76 s.
In order to do this we need to know how long it will take the athlete to get to the top of their jump.
| Quantity | Value |
| v | 3.7 m/s |
| u | 0 m/s |
| a | -9.8 m/s2 |
| t | ? |
This is the time it takes to reach the top of the jump. It will take the same time to return to the ground.
Total time in air = 2 x 0.38 s = 0.76 s
(c) Calculate the horizontal displacement sh between points P and Q.
With the horizontal speed and the time of the athlete in the air we can work out how far horizontally they have gone.
| Quantity | Value |
| s | ? |
| v | 8.3 m/s |
| t | 0.76 s |
The displacement moved was 6.3 m to the right. Remember that displacement is a vector and requires a direction in the answer.
You could also specify that the direction to the right is positive and then give a positive answer.
The final displacement = +6.3 m.
Practice SUVAT questions
Calculating uniform acceleration
Attempt to solve the question yourself before clicking the solve button!
Calculating how long it takes to reach a maximum height
Attempt to solve the question yourself before clicking the solve button!
Determining an initial speed
Attempt to solve the question yourself before clicking the solve button!
Motion-Time Graphs
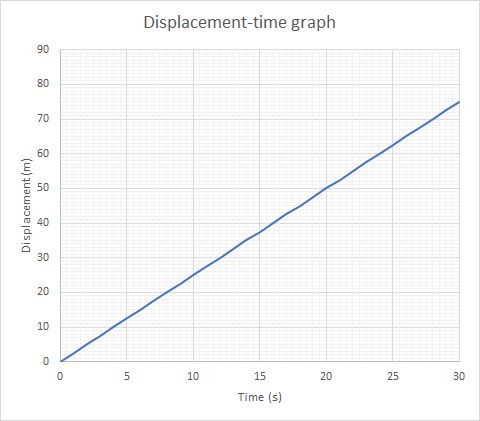
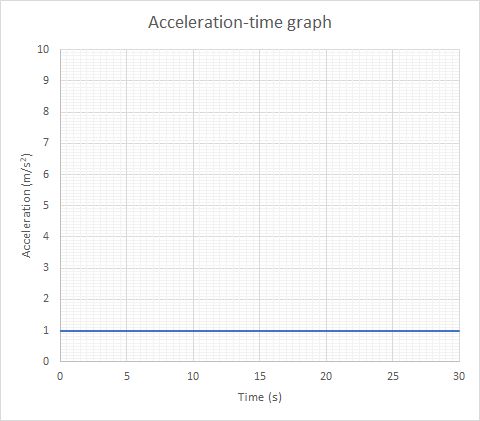
Below are typical graphs that show the motion of objects with either no acceleration or a uniform acceleration.
There are three types of graph for each case. The three types of graph are
displacement-time graphs - which show how displacement changes over time
velocity-time graphs - which show how velocity changes over time
acceleration-time graphs - which show how acceleration changes over time
Remember that the SUVAT equations only work when there is no acceleration, or when the acceleration is constant.
Hovering your pointer on a graph will enlarge it
| Stationary | Constant velocity | Constant acceleration | |
|---|---|---|---|
| displacement-time | 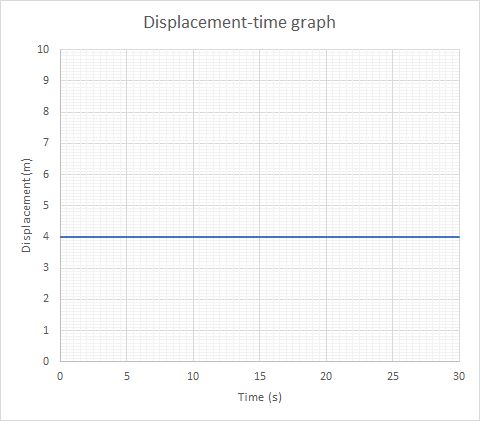 |
 |
 |
| velocity-time | 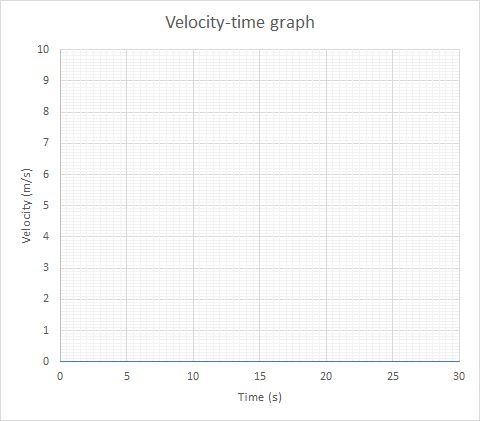 |
 |
 |
| acceleration-time | 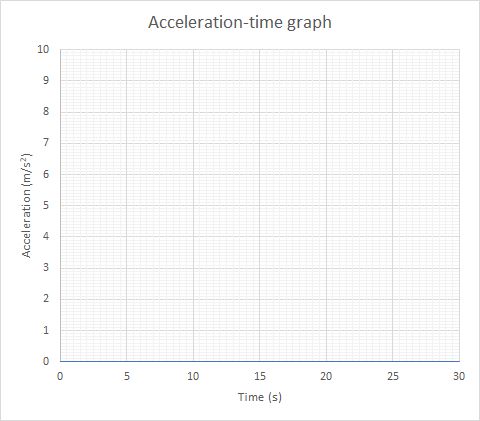 |
 |
 |
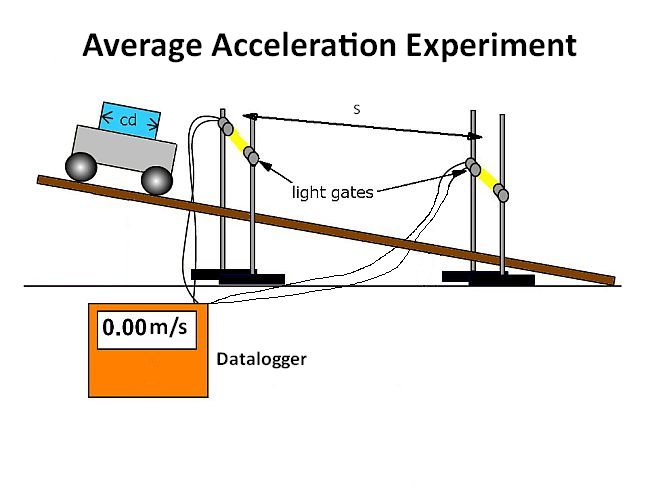
Acceleration Experiment
To determine the acceleration of a cart down a slope we use light gates separated by a fixed distance, d. Using a card on the cart with known width it is possible to determine the instantaneous velocity of the cart at each of the light gates. This gives an initial velocity, u, at the first gate and a final velocity, v, at the second gate. We can then use the equation:The distance, s, between the light gates is substituted in to the equation as the value for s. This means that we can then determine the average acceleration of the cart along the ramp.
The width of the card that cuts the light beam (cd) is entered into the datalogger and it determines the velocity of the cart through the light gate.
An experimental setup would look like this:
If the animation below has finished then move the mouse over the animation title to reset it to run again.
The value of the velocity from the first light gate gives us the initial velocity, u.
The value of the velocity from the second light gate gives us the final velocity, v.
| d (m) | u (m/s) | v (m/s) | a (m/s2) | |
|---|---|---|---|---|
| Experiment 1 | 1.00 | 0.50 | 2.50 | |
| Experiment 2 | 1.00 | 0.48 | 2.51 | |
| Experiment 3 | 1.00 | 0.51 | 2.49 | |
| Average | 1.00 | 0.50 | 2.50 | ? |
Using the following equation we can work out the acceleration:
Where v = 2.5 m/s
u = 0.5 m/s
s = 1.0 m
a = ?
a = 3.0 m/s2
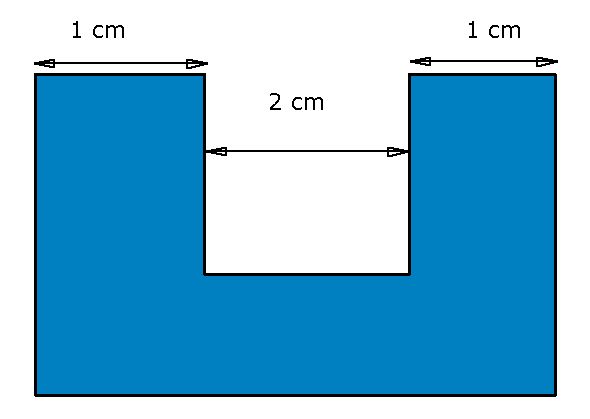
If only one light gate is available the acceleration of the cart can be determined by using a card with a notch cut through it.
This will allow two speed readings with a known separation - the width of the notch cut out.
If the animation below has finished then move the mouse over the animation title to reset it to run again.
The datalogger will have inputs to allow the card measurement to be entered. This then allows the instantaneous acceleration to be determined by the datalogger.
Vectors PowerPoint
Resolving Vectors into components PowerPoint
Graphs
Graphs PowerPoint