Gas Laws and the kinetic model
Pressure
When thinking about the physics of gases, the concept of pressure is a major consideration. In this section we will consider pressure as a function of force and area.
Pressure is defined as the force applied per unit area.
The relationship between pressure, force and area is given by:
Where:
P is pressure (Pa)
F is force (N)
A is area (m2)
It is important to remember that the area has to be in m2 because in many questions the area may be given in mm2 or cm2. Therefore the conversion between these units is important to be able to determine.
Consider the example of an elephant and a high heeled shoe. Instinctively you might think that the heavier mass of the elephant would mean that it exerts a higher pressure on the ground than the heel.
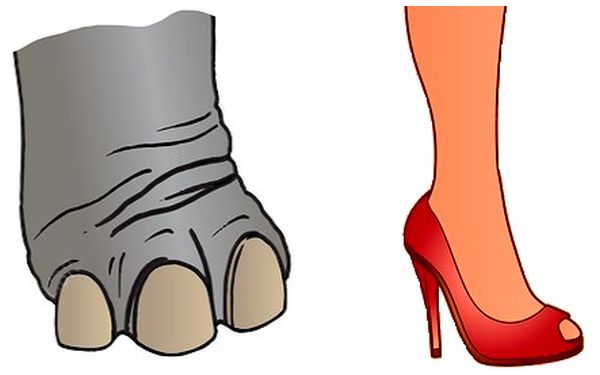
Let us use our knowledge of the relationship between force and area to see which exerts the higher pressure. An elephant has a mass of approximately 600 kg, whereas the mass of the person wearing the high heel has a mass of 50 kg. Let us approximate the area of an elephant's foot to a circle of diameter 1.2 m and the heel a a circle of diameter 1.0 cm. Remember that an elephant has 4 feet, so the pressure is across all 4 feet, which is 4 times the area. There are also two high heels, so this area must be doubled as well.
| Elephant | High heel | |
|---|---|---|
| Mass (kg) | 600 | 50 |
| Weight (N) | 5880 | 490 |
| Area (m2 | 1.13 | 7.85 x 10⁻⁵ |
| Pressure | 5880/(4 x 1.13) | 490/(2 x 7.85 x 10-5) |
| Pressure (Pa) | 1300 | 3.12 x 10⁶ |
As you can see from the table the pressure from the high heels is many times higher than the pressure from the elephant foot. This is because of the very small area given by the 0.5 cm radius of the high heel in comparison to the 0.6 m radius of the elephant foot.
Pressure in a gas is also a measure of force per unit area. THe area that we must consider is the area of the surface of the vessel holding the gas. At any temperature above absolute zero the gas particles will have an average kinetic energy related to their temperature. The moving particles will strike with the walls of the container. When they hit the walls of the container and rebound they exert a force on the container. With the many collisions across the face of the container the pressure is effectively the average force exerted by the colliding gas particles per unit area of the surface walls of the container.
The Kinetic Model
The volume of a gas is determined by the size of the container when dealing with a rigid structure, such as the gas cylinder you find on a sodastream fizzy drinks maker. The volume of a gas in a flexible sided container is determined by many different factors. To understand the relationship between the different factors it is first necessary to understand how gases move inside a container. This is called the kinetic model.
In the short video below you can see the change of state from solid to liquid and then to gas as the substance is heated.
Solid - all the paricles vibrate about fixed points and the substance has a fixed shape.
Liquid - The particles are all touching one another, but are able to move randomly past each other and the substance takes the shape of its container.
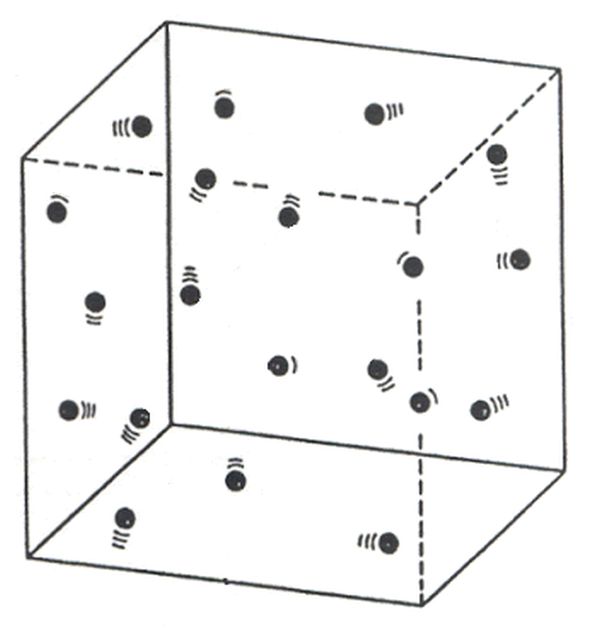
Gas - all the particles are separated from each other and have constant collisions between themselves and the walls of the container. The particles take up the shape and total volume of the container.
Pressure - The gas particles exert pressure on the walls of the container when they collide with the walls of the container. We will look at this in more detail below.
As you can see in the video and diagram above gas particles are spaced far apart. They are moving randomly in straight lines. They change direction when they collide. This collision can be with another gas particle or the walls of the container.
When a gas particle hits the wall of the container it will rebound. The particle exerts a force on the wall. According to Newton's Third Law the wall will exert an equal and opposite force on the gas particle. This force being exerted by the wall can be measured using a pressure meter. The average amount of force over a known area of wall gives us the pressure of the gas in the box.
Changing the amount of gas in the box
If we increase the amount of gas in the box there will be more particles. With more particles colliding with the walls each second there will be a greater average force. The pressure will increase.
If we reduce the amount of gas in the box there will be fewer gas particles present. Fewer gas particles will result in fewer collisions per second with the walls. The consequence is that the average force decreases and so the pressure goes down.
Changing the temperature
It is important to rememeber that the temperature of a gas is a measure of the average kinetic energy of the particles in the gas.
When the temperature increases so does the average kinetic energy of the particles. This means that their average speed will be greater. When they move faster they will collide with the walls with a greater force. The walls will exert an equal and opposite force to this bigger force. This is measured as an increase in the pressure. Remember that P = F/A and therfore increasing average force increases pressure for a vessel where the volume does not change, and the surface area of the walls remains constant. Temperature increase will also result in more collisions per second with the walls
Lowering the temperature results in slower moving particles because they have a lower kinetic energy. These lower enegy particles will collide with the walls with a smaller force. This smaller force results in a reduced pressure on the walls if the container.
Changing Volume of the Container
If we keep the amount of gas the same as well as the temperature we can still change the volume of the container and find out the effect on the pressure of the gas.
Increasing the volume of the container results in a greater surface area for the walls of the container. When the particles strike a larger surface area they will produce a lower pressure. Remember that P = F/A and making the area greater will cause the value of the fraction to become smaller.
Gas Pressure Laws
There are three laws that students of National 5 physics are required to know, both the theory and the emxperiments which support the theory.
Gas Volume-temperature Relationship (Charles' Law)
The relationship between the temperature and volume for a fixed mass of gas at a constant pressure is given by:
In the above equation the temperature scale MUST be the Kelvin scale. In many exam questions the celcius scale will be used, and in Multiple Choice answers, the incorrectly calculated value while using Celcius will be in the choices. Therefore students think that their answer is correct, when it is not so, because the temperature scale must be converted to Kelvin from Celcius.
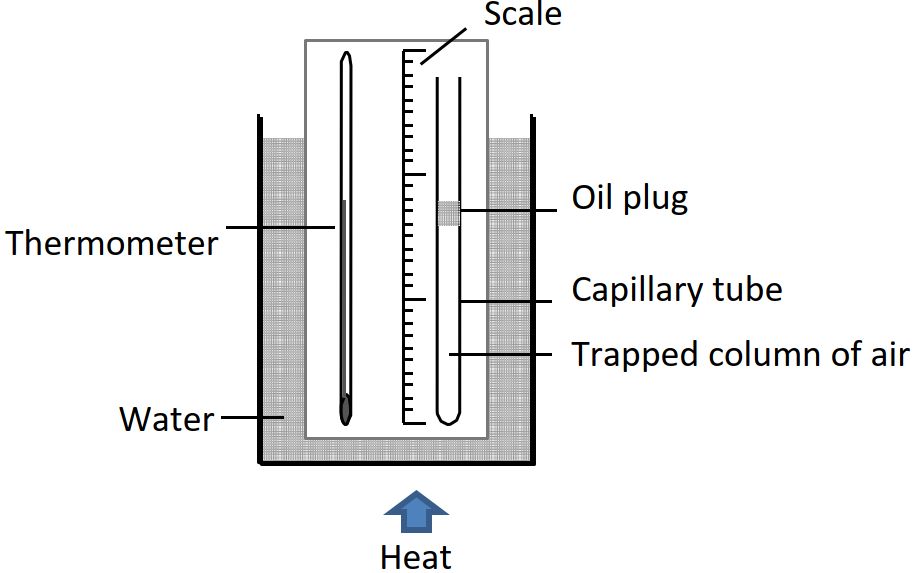
An experiment to show the relationship between volume and temperature uses a capillary tube sealed at one end with an air gap sealed at the other end with a moveable plug of oil. A ruler is used to measure the length of the air gap in the capillary tube at different temperatures. The height of the air gap is direclty proportional to the volume of the air gap because the capillary tube is a uniform cylinder. This can be seen in the diagram below.
From mathematics we know that the volume of a uniform cylinder is equal to the product of its base and the length of the cylinder.
Where:
V is the volume of the cylinder
A is the area of the cylinder base
h is the length of the cylinder
As the water is gently warmed, the temperature can be read from the thermometer and the height of the air gap can be measured. A set of results from this experiment can be seen in the table:
| Temperature (°C) | Height of air gap (mm) |
|---|---|
| 15 | 79 |
| 25 | 80 |
| 35 | 82 |
| 40 | 84 |
| 45 | 87 |
| 50 | 88 |
| 60 | 90 |
| 70 | 93 |
Plotting a graph of height of air gap versus temperature produces the following graph:
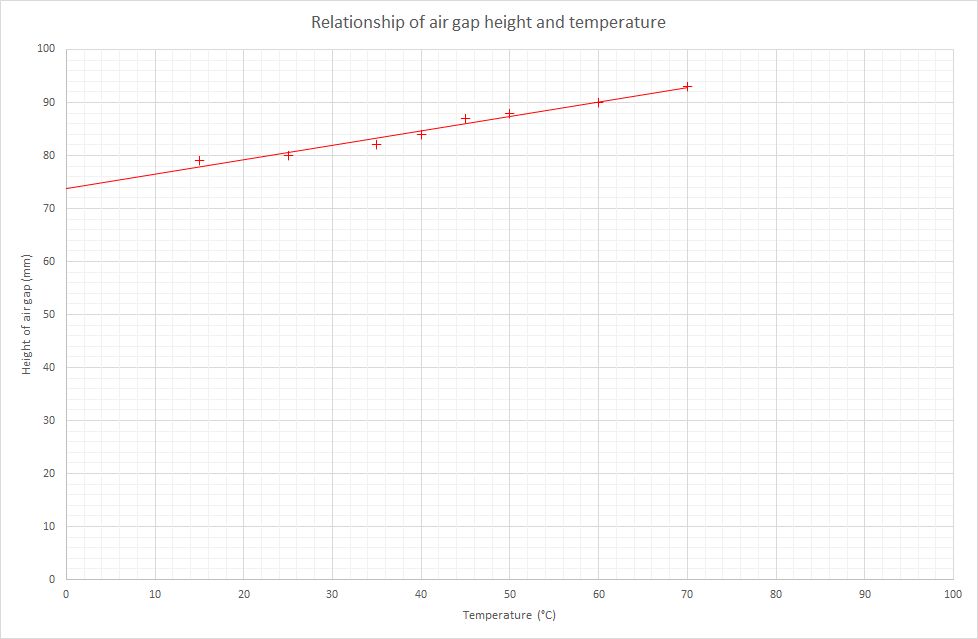
From this graph we can see that there is a straight line relationship between the height of the air gap and the temperature. This is a proportional relationship, but not directly proportional. What happens to the line if we extend it back to here it crosses the x- axis? The graph below shows the line of best fit being extended back to the temperature axis.
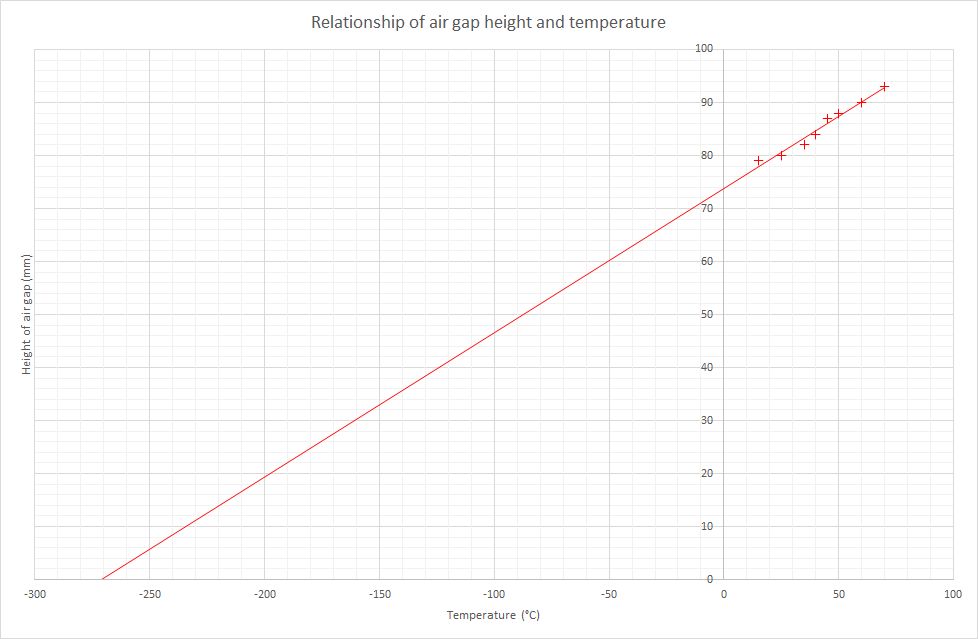
The line of best fit crosses the x-axis at a temperature just below -270 °C. In a more accurate experiment it has been shown that the accepted value of where the line would cross the axis is -273 °C. At this temperature all forms of motion have stopped. There is no motion energy in the system at all and all the particles are in fixed positions, without even any vibrations. No motion at all. This temperature is known as ABSOLUTE ZERO. The kelvin temperature scale is based upon this value.
Kelvin Temperature Scale
The kelvin temperature scale is an absolute temperature scale. It is unlike the celcius scale which is based on two fixed points. (0 °C - freezing point of water and 100 °C - boiling point of water.) When using the kelvin scale there is no need for the ° symbol, because it is an absolute scale. All other temperature scales are relative scales and use the deg; symbol e.g. °C, °F.
At absolute zero on the kelvin scale all particle motion has stopped.
To convert from celcius to kelvin a value of 273 must be added to the celcius number. To convert from kelvin to celcius the value of 273 must be subtracted from the kelvin value. The relationship between the kelvin and celcius temperature scales is given by the following equation:
Calculate the temperature of the room in kelvin when its temperature is 21 °C
Converting from ° C to Kelvin requires us to add 273 to the celcius number. The tepmerature in kelvin is 21 + 273 = 294 K
Determine the temparature of a gas in °C which has a temperature of 350 K.
Converting from K to °C requires us to subtract 273 from the kelvin number. The temperature in °C is 350 - 273 = 77 °C.
Abolsute zero is the coldest possible temperature in the universe. There is nowhere in the universe that is that cold. Even in the deepest reaches of space the background temperature is 2.7 K. The coldest temperature recorded in a lab on Earth is 0.10 nK.
Change of volume Charles' Law calculation.
A fixed mass of gas with a temperature of 27 °C has a volume of 400 cm3. The temperature of the gas is increased to 327 °C. Calculate the volume of the gas at this higher temperature.
This is a volume-temperature relationship question and the equation that we use is:
There is an additional step before we can use the relationship above. This is because the relationship only works when we are using absolute temperatures. We therefore have to convert any temperature from its value in °C to a value in kelvin. This is done by adding 273 to the °C value.
- T1 = 27 + 273 = 300 K
- T2 = 327 + 273 = 600 K
- V1 = 400 cm3
- V2 = ?
Substituting these values into the equation gives:
Evaluating the above expression gives a final volume of:
Change of temperature Charles' Law calculation
A fixed mass of gas at a constant pressure with a volume of 2.00 m3 at a temperature of 127 °C is compressed into a volume of 1.00 m3 without changing the pressure. Determine the temperature of the gas at this new volume.
There is an additional step before we can use the relationship above. This is because the relationship only works when we are using absolute temperatures. We therefore have to convert any temperature from its value in °C to a value in kelvin. This is done by adding 273 to the °C value.
- T1 = 127 + 273 = 400 K
- T2 = ? K
- V1 = 2.00 m3
- V2 = 1.00 m3
Substituting our values into this equation gives us:
Evaluating this expression gives us a final temperature of:
Gas Pressure-temperature Relationship (Gay-Lussac's Law)
The relationship between pressure and temperature for a fixed volume of gas is given by:
In the above equation the temperature scale MUST be the Kelvin scale. In many exam questions the celcius scale will be used, and in Multiple Choice answers, the incorrectly calculated value while using Celcius will be in the choices. Therefore students think that their answer is correct, when it is not so, because the temperature scale must be converted to Kelvin from Celcius.
An experiment to show the relationship between pressure and temperature uses a flask submerged in a water bath connected to a pressure guage (Bourdon guage). This can be seen in the diagram below.
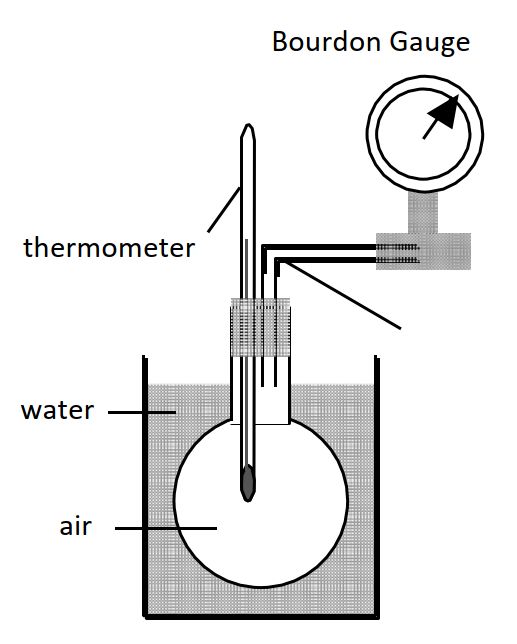
The water is warmed to a high temperature and maintained at this temperature until the thermometer registers a high temperature. The heat source is taken away and the water is allowed to cool. At the gas in the flask cools the pressure of the gas is recorded. A sample set of results is given below.
There is some debate about where to put the thermometer in this experiment. Often you will see diagrams where the thermometer is in the water bath, and not the flask. This is generally how the experiment is carried out in schools because the transfer of heat energy from the water to the thermometer is much more efficient when in water. If the experiment is carried out over a long time, where there is sufficient time for the air temperature in the flask to have transferred sufficient heat energy to get an accurate reading on the thermometer then the experiment can be carried out the way shown in the diagram. The exam board tends to favour this experimental procedure, although it is not the one carried out in class.
| Temperature (°C) | Pressure (kPa) |
|---|---|
| 60 | 110 |
| 55 | 108 |
| 50 | 105 |
| 45 | 104 |
| 40 | 102 |
| 35 | 101 |
| 30 | 100 |
| 25 | 98 |
| 19.5 | 96 |
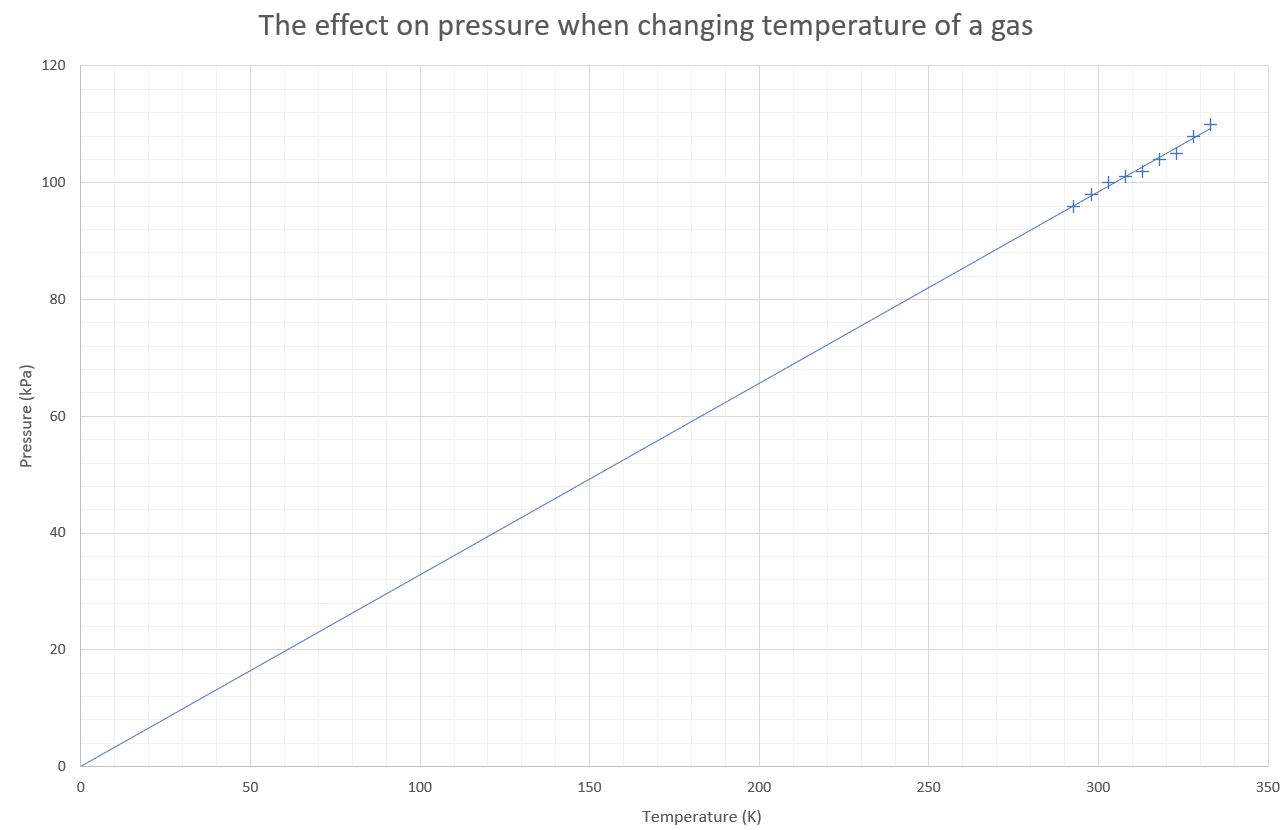
A graph of these results is shown below:
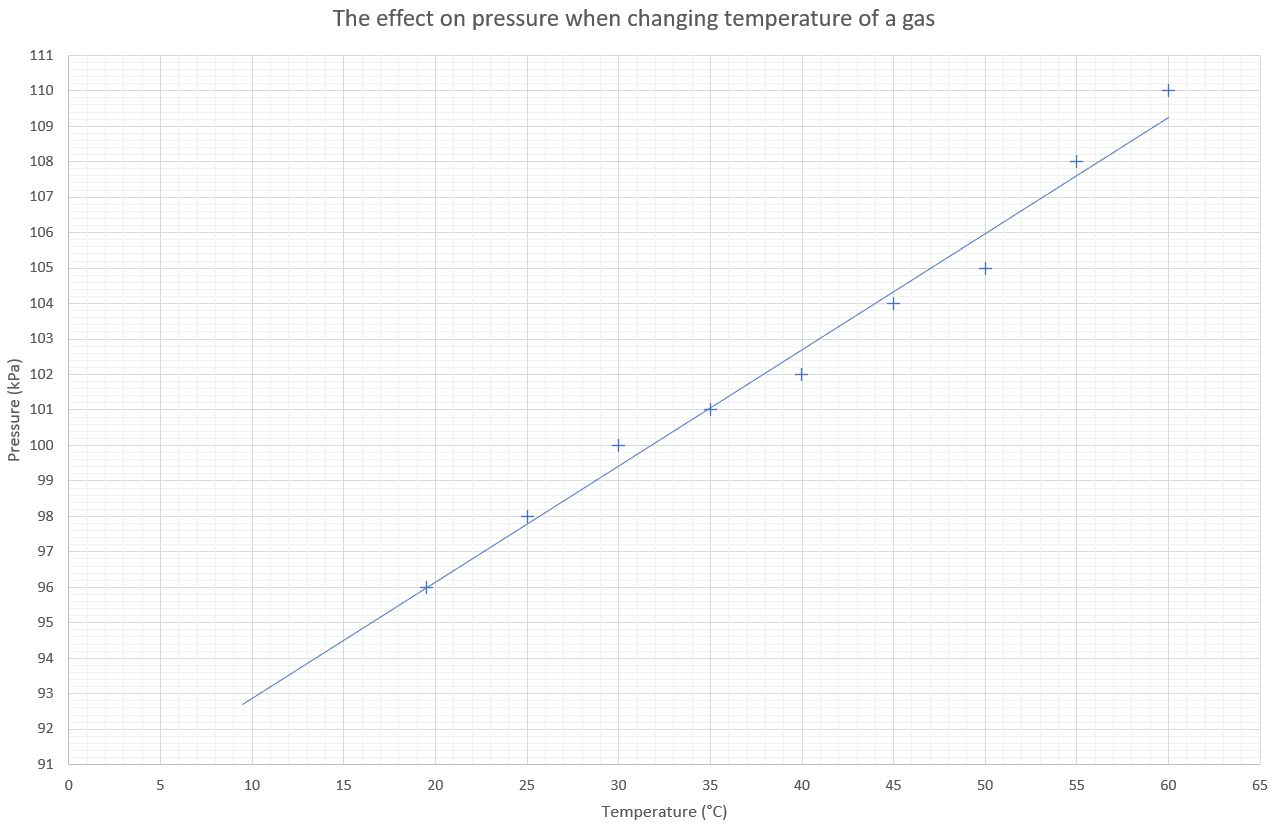
We can clearly see from these results that the relationship between pressure and temperature is linear. These results are proportional. What would the temperature of the gas be if we were to have a pressure of 0 kPa? To find this out we can extend the line of best fit backwards. This is shown in the graph below:
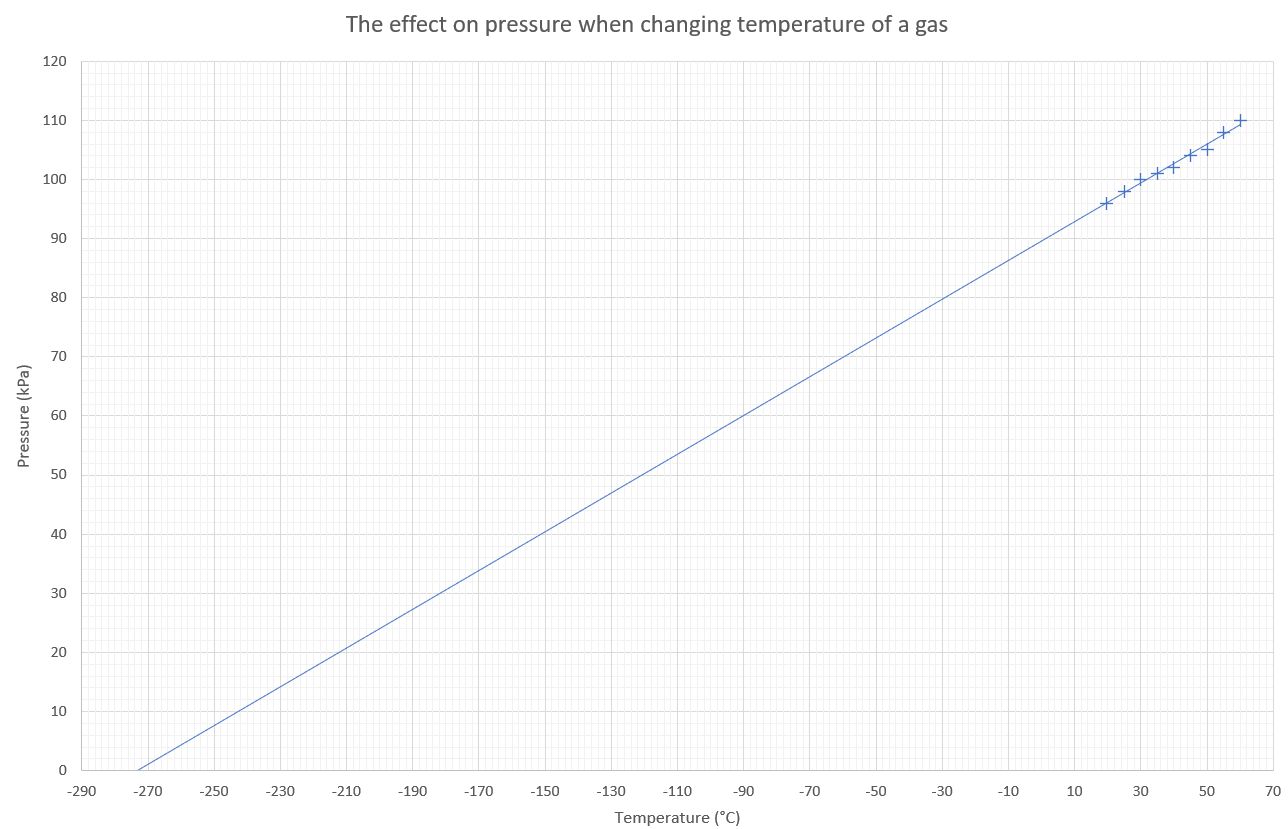
We can see in this second graph that the temperature for a 0 kPa pressure reading is -273 °C. This is the absolute zero again that we met in the Charles' Law experiment. In terms of the physics of this temperature we can understand why there would be no pressure at absolute zero. All particle motion has stopped at absolute zero. Since the gas particles cannot move to strike the walls of the container, they cannot exert any pressure on the container. Therefore at 0 K, the pressure must also be 0 kPa.
We can see from the graph above that the temperature-pressure relationship is directly proportional providing we are using the kelvin temperature scale. It is vitally important when doing any calculations with gases that the temperature scale used in the calculations is the kelvin temperature scale. This often requires us to convert temperatures from the celcius scale into the kelvin scale.
Change of temperature calculation
A fixed mass of gas with a temperature of 27 °C has a pressure of 100 kPa. The temperature of the gas is increased to 327 °C. Calculate the pressure of the gas at this higher temperature.
This is a pressure-temperature relationship question and the equation that we use is:
There is an additional step before we can use the relationship above. This is because the relationship only works when we are using absolute temperatures. We therefore have to convert any temperature from its value in °C to a value in kelvin. This is done by adding 273 to the °C value.
- T1 = 27 + 273 = 300 K
- T2 = 327 + 273 = 600 K
- P1 = 100 kPa
- P2 = ?
Substituting these values into the equation gives:
Evaluating the above expression gives a final pressure of:
Change of pressure calculation
A fixed mass of gas at a constant volume with a pressure of 100 kPa at a temperature of 27 °C is measured later to have a pressure of of 400 kPa without changing the volume. Determine the temperature of the gas at this new pressure.
There is an additional step before we can use the relationship above. This is because the relationship only works when we are using absolute temperatures. We therefore have to convert any temperature from its value in °C to a value in kelvin. This is done by adding 273 to the °C value.
- T1 = 27 + 273 = 300 K
- T2 = ? K
- P1 = 100 kPa
- P2 = 400 kPa
Substituting our values into this equation gives us:
Evaluating this expression gives us a final temperature of:
Gas Pressure-volume relationship (Boyle's Law)
This law differs from the two (Charles' and Gay-Lussac) laws that we have already met. When dealing with this law it is important to understand that the temperature must remain constant . The equation showing the relationship between pressure and volume is:
This equation shows us that the value of the pressure in pascals multiplied by the volume in m3 equals a constant value.
The standard units for pressure (Pa) require the volume to be measured in m3 for calculations that require the constant to be obtained. In most questions this is not required and it is often possible to work with the volume unit (e.g. cm3 or dm3) given in the question.
You may have noticed that the equation for this relationship is quite different from the pressure - temperature (Gay-Lussac Law) and the volume - temperature (Charle's Law) relationships. In order to investigate the relationship between pressure and volume there are two methods commonly used in schools. The first is an example using a datalogging pressure sensor and a syringe, shown below:
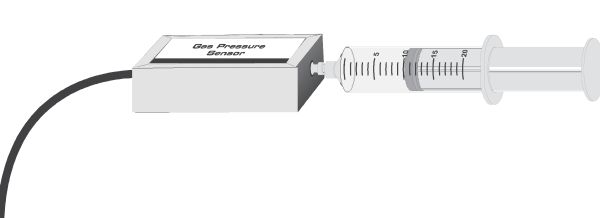
In this experimental with the syringe there is often a hidden systematic uncertainty. This is due to the volume of the tube connecting the syringe to the pressure guage. This volume is often not known to a high accuracy and this results in the volume measurements all being too high, or too low by a set amount. In an exam question you may see that the exam board have used a long piece of tubing to connect the syringe to the pressure guage. A question may then be asked about how to improve the experimental resutls. You can then comment that using a shorter piece of tubing to reduce the uncertainty in the volume reading will improve the accuracy of the experiment.
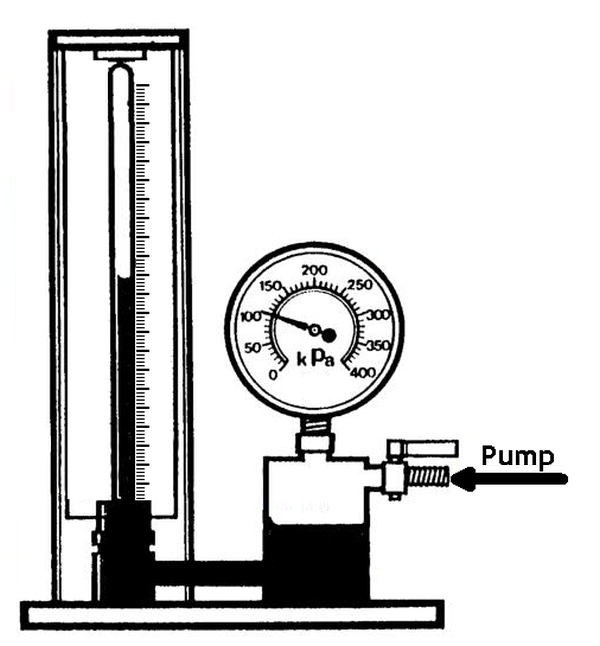
The second experimental procedure uses a Bourdon guage attached to a liquid resevoir which can compress air in a tube with a volume scale as shown in the diagram below:
In both of these experiments when a graph of pressure versus volume is plotted the results are in the shape of a smooth curve. This is shown in the graph below:
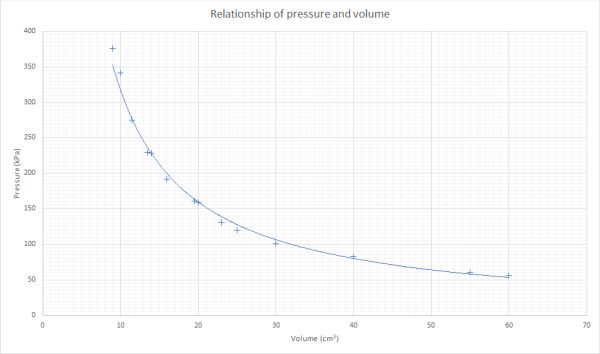
The graph shows us that as the pressure increases, the volume decreases. This is an example of an inverse relationship. One factor goes up, while the resulting factor goes down. In order to generate a straight line for the experimental results we must plot pressure against 1/volume. When the pressure is plotted against 1/volume values an example graph is shown below:
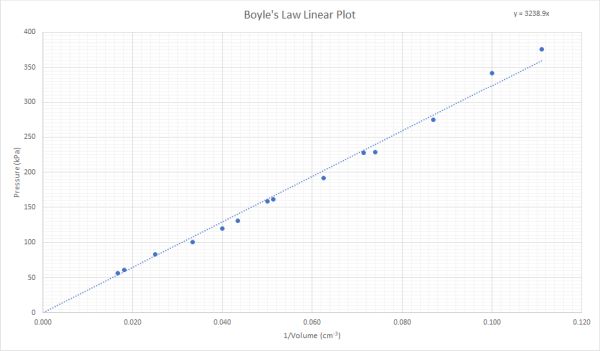
This shows us that the pressure is inversely proportional to the volume. In exams it is important to recognise that the pressure - volume relationship is the one that produces a curve when it is plotted from the raw data. The other two relationships (Charle's and Gay-Lussac) produce straight lines immediately from the raw data.
Combined gas law
The three gas laws can be combined into a single equation. This is given below:
This is probably more usefully expressed as.
This form of the equation is not given by the exam board, but is a useful one to remember.
In this case if we have a change in both pressure and temperature, it is still possible to calculate the change in volume as well.
Example calculation
An ideal gas has a volume of 2.0 m3 at a temperature of 27 °C and a pressure of 101 kPa. The temperature increases to 250 kPa and the temperature also rises to 127 °C. Determine the volume of the gas in these new conditions.
First, let us extract the numerical information from the question:
P1 = 101 kPa
T1 = 27 °C = 27 + 273 = 300 K
V1 = 2.0 m3
P2 = 250 kPa
T2 = 127 °C = 127 + 273 = 400 K
V2 = ? m3
The equation to use is:
Substituting in values gives us:
On solving this we get a value for V2 as