Cosmology
How old is our Universe? Where did it come from? What will happen to it in the future? Is there life anywhere else in the universe? Astrophysicists, astrochemists and astrobiologists carry out experiments and make observations to try and answer these questions.
Distances
When we measure distances on earth we tend to use kilometres or miles. These units are too small when thinking about distances to objects in space. To make the measurement easier astronomers use the lightyear as a way to measure distance.
Light travels at 3.0 x 10⁸ m/s, so in one year it will travel:
365.25 × 24 × 60 × 60 × 3.0 × 108 = 9.5 × 10¹⁵ m.
We have converted 1 year to days to hours to minutes to seconds and then multiplied by the speed of light in m/s.
The closest star to our sun (Proxima Centauri) is 4.22 light years away.
That means it is 4.22 × 9.5 × 1015 = 3.8 × 10¹⁶ m away from our planet. Light from Proxima Centauri takes 4.22 years to get to us here on Earth from the time it was emitted from the surface of the star.
The further away a star is, the longer it has taken light to reach us and so the further back in time we are looking. Is it possible that there is a limit to how far back in time we can see?
Origin of the Universe
The Big Bang Theory is generally accepted by astrophysicists to be the theory that explains the origin of the universe.
This theory states that the universe originally started approximately 13.8 billion years ago as a small point. This point was not in space, because there was no space at all. All the matter, energy and space that we find in the universe now was compressed into this small point.
When the Big Bang started there was a period of immense inflation.
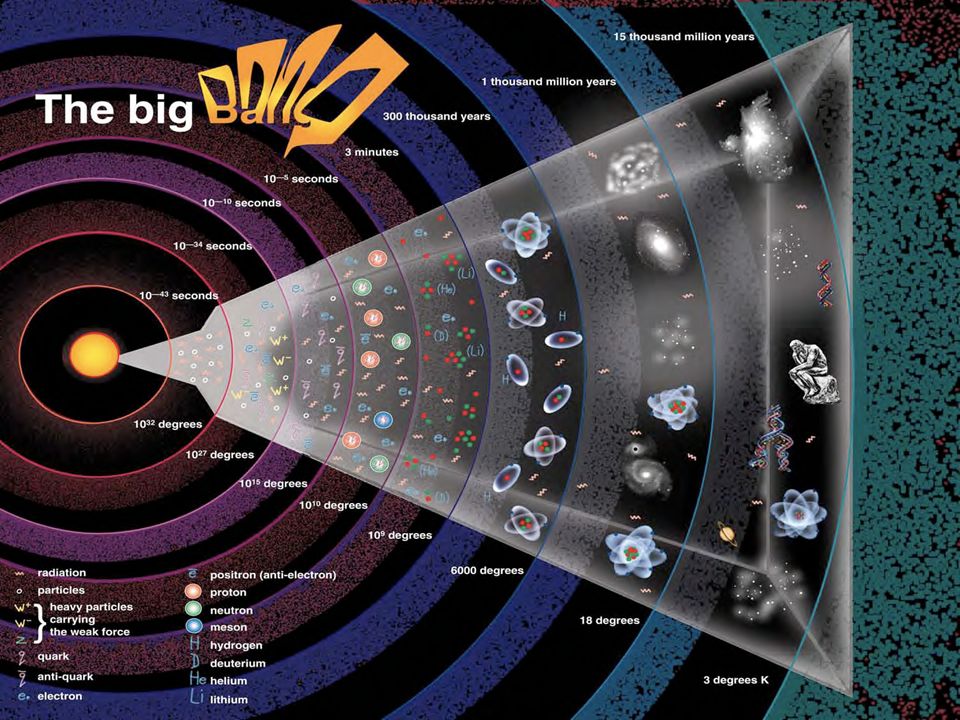
Once the inflationary period was over the universe continued to expand.
Evidence Supporting the Big Bang Theory
The Expanding Universe
Edwin Hubble, an astronomer determined in the 1920s that galaxies were moving away from each other. He also noticed that galaxies which are far away are moving faster than galaxies which are closer. He was able to plot a graph of galaxy speed versus galaxy distance.
To reset the animation below just move your cursor over the title.
Below there is a graph from observations by the Hubble space telescope of distant supernovae which shows more up to date experimental data for Hubble's original work.
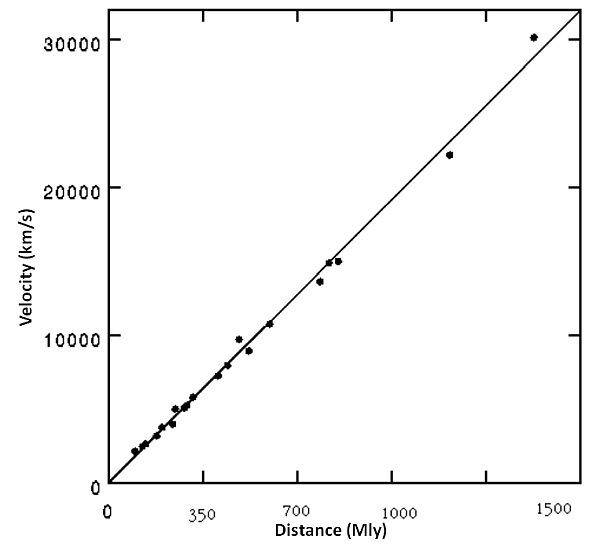
The graph clearly shows that things which are further away are moving faster. What about taking this data and running the clock backwards to bring all of the galaxies back together. When we do this we find that all the matter of space forms a tiny spot, an origin where it was all together in the past. The time that this tiny volume existed was 13.8 billion years ago. This is the estimated age of our universe which began with the big bang.
The expansion of the universe is a key piece of evidence for the Big Bang Theory.
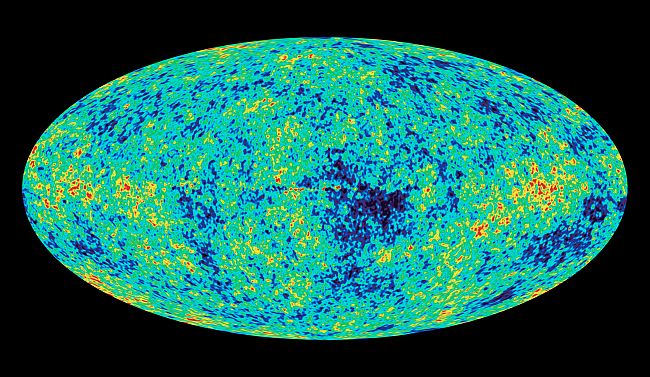
Cosmic Microwave Background Radiation
The wavelength of the light at the beginning of the universe was in the gamma region of the electomagnetic spectrum. As the universe has expanded this light has been stretched to a much longer wavelength. It should be possible to point our telescopes at any part of the night sky to see this stretched out light. When looking in all directions microwave electromagnetic radiation with a temperature of 2.7 Kelvin can be detected. This is the afterglow of the Big Bang. It is another piece of evidence for the Big Bang, and is called the Cosmic Microwave Background Radiation.
Element Composition of the Universe
A third piece of evidence supporting the Big Bang Theory for the start and development of our universe is the elemental composition. We can use a variety of parts of the electromagnetic spectra to find out which elements are present in the universe.
Continuous Spectrum
When white light passes through a prism it is possible to see a complete rainbow. This is called a continuous spectrum because it contains all of the frequencies of light.
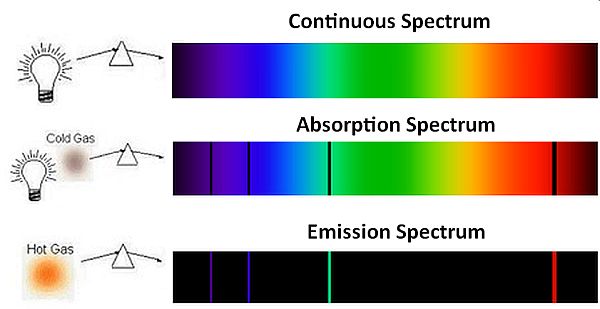
Line Spectrum
When we pass light from a hot gas, through a prism we find that there specific lines generated, and that the spectrum is not continuous. The colours of the lines produced depends upon the element that is present. In the example above the absorption and emission spectra both involve the same element. You can see that in one the lines are missing from the full spectrum, and in the other the lines are the only part of the spectrum that has been produced.
The element in the emission spectrum and the absorption spectrum is known to be hydrogen, because of the specific pattern that it produces. Each element is unique and using telescopes that can view IR, visible and UV light we can build up a picture of the elements present in the universe.
Identifying Elements in Stars
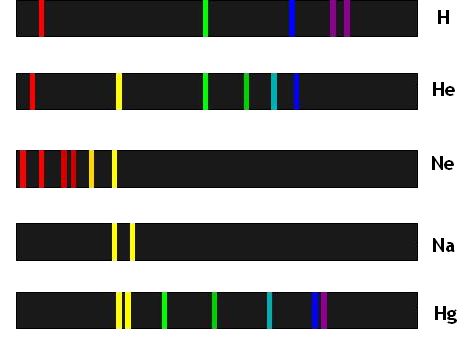
All elements have a unique line spectrum. Below are some example emission spectra for the elements hydrogen, helium, neon, sodium and mercury
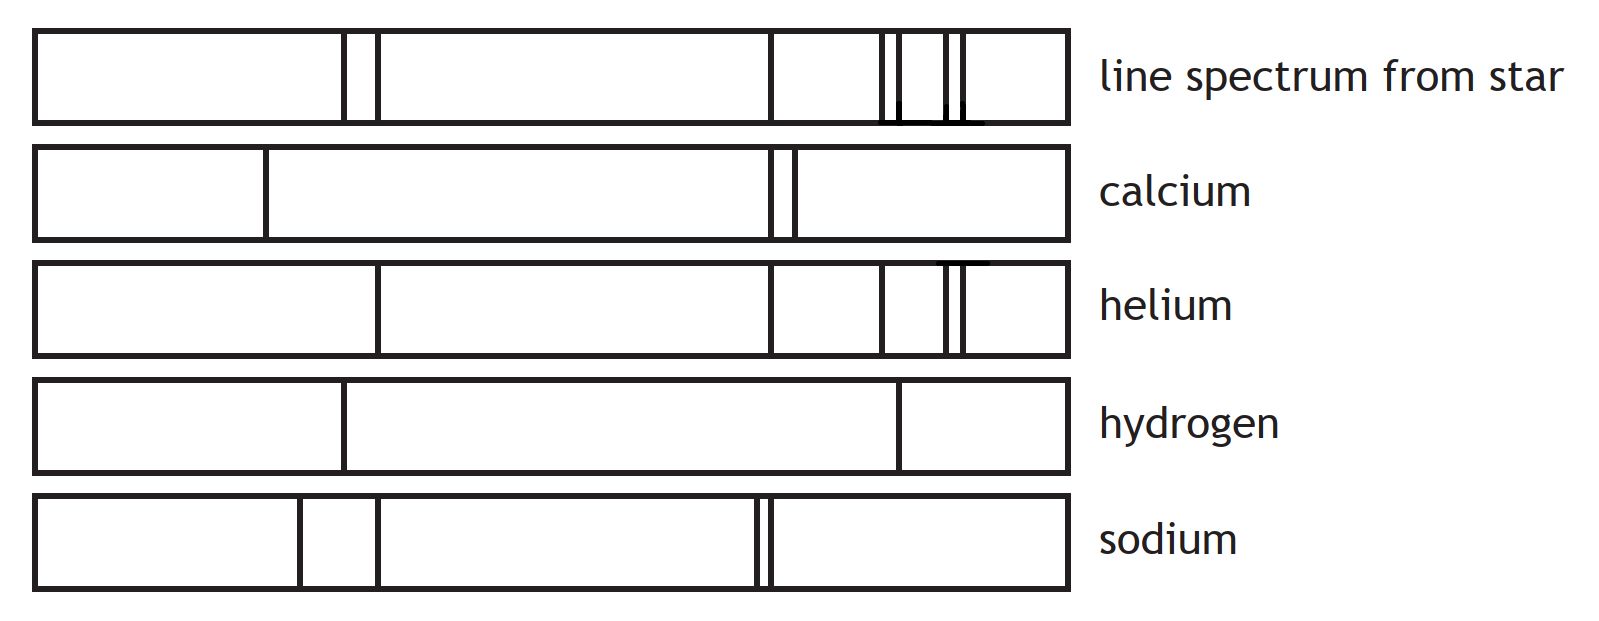
Using a spectrometer the following data is obtained about a star. It can be used to identify elements present in the star, by matching up lines from known spectra with lines from the spectrum abtained from the star
Lines are drawn down from the star specrum until they meet with corresponding lines from the elements. This can be seen by the added green lines in the diagram below
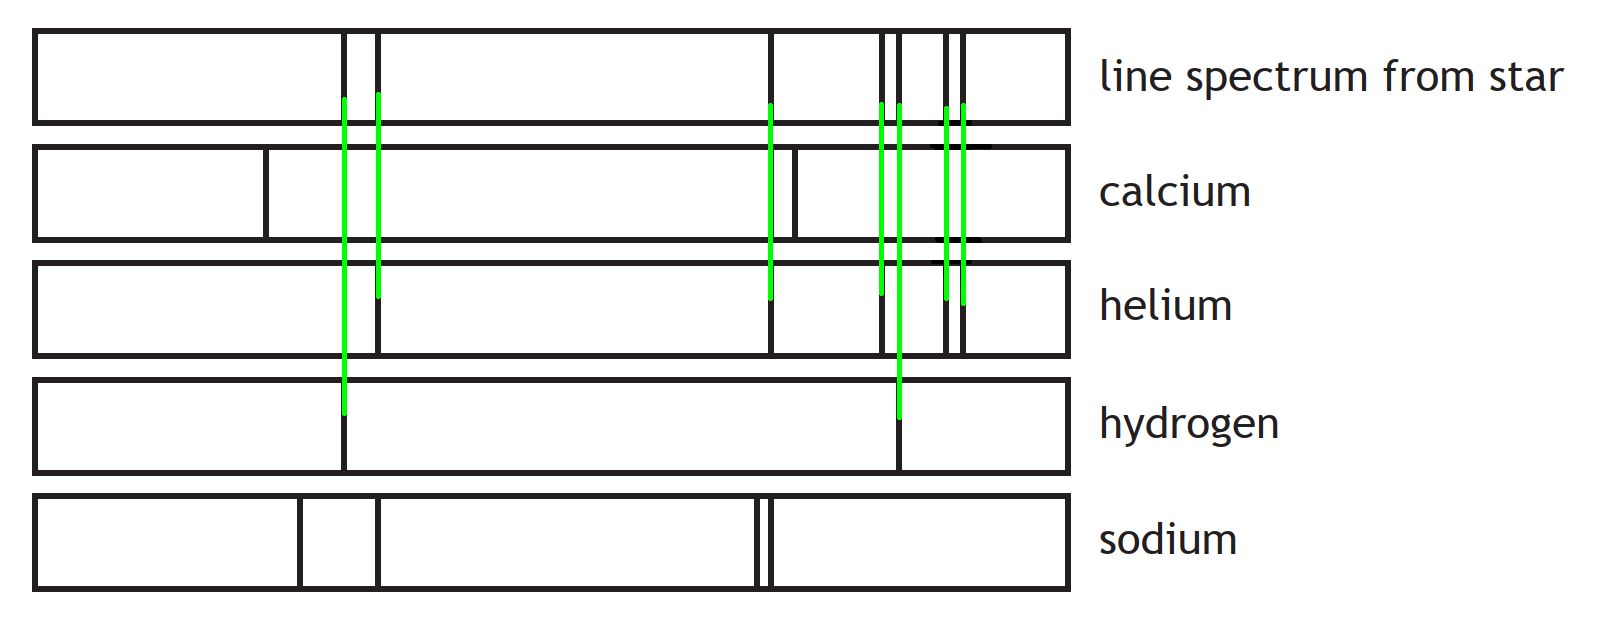
We can see that the star has the elements hydrogen and helium in it. This is because all of the spectral lines from both hydrogen and helium match with all of the lines in the spectrum of the star. There is one line that also lines up with calcium, but because the other calcium lines do not appear in the star spectrum we can discard that element. This reminds us that for an element to be present, all of its spectral lines must appear in the spectrum of the star.