Vectors and Scalars
Table of Vectors and Scalars
| Vectors | Units | Scalars | Units |
|---|---|---|---|
| Displacement | m | Distance | m |
| Velocity | m/s | Speed | m/s |
| Weight | N | Mass | kg |
| Force | N | Time | s |
| Acceleration | m/s2 | Energy | J |
Scalar quantities are those ones which just have a size. They do not have a specific direction in which they act.
Vector quantities are those ones which have both a size and a specific direction (e.g.force)
Maximise the activity below and see if you can correctly classify quantities as scalars or vectors.
Adding Vectors
We must always remember that vectors have both size and direction.
In the diagram below there is a block with a 12 N force acting on it to the right. The friction force is 7 N to the left. To add these two vectors we should decide which direction is positive. In this case we will say that the vector facing right is positive. This means that the vector pointing left has a negative value.
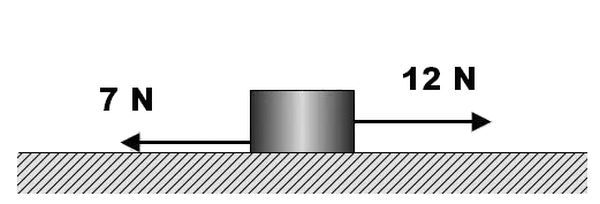
We can add the two forces to find the net force (Fnet).
Fnet = 12 + (-7) = 5 N
It is also possible to draw arrows to represent the vectors. The arrows must be added head to tail. A scale should be selected e.g. 1 cm = 1 N. The arrows are then drawn to this scale.

The resultant vector can then be drawn. It is drawn with its tail at the tail of the first vector and its head at the head of the second vector.

Vectors at right angles
Consider an aeroplane travelling due north at 120 ms-1. There is a crosswind that is acting due east at 90 ms-1. What is the actual speed and direction of the aeroplane?
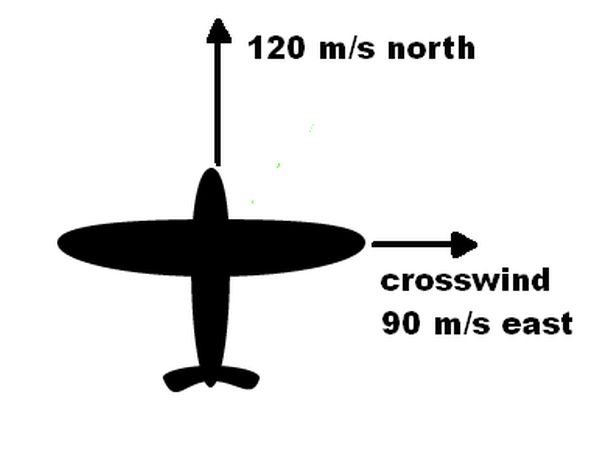
To solve this we use Pythagoras and trigonometry. The first stage is to draw the vectors head to tail in order to know the correct trigonometry to use. In order to simplify the drawing the plane can be replaced by a dot. Remember that the vectors must be added head to tail. In the original drawing the vectors are tail to tail and so we must move one of the vectors so that they are arranged head to tail. Then add the resultant vector as you can see in the following diagram.
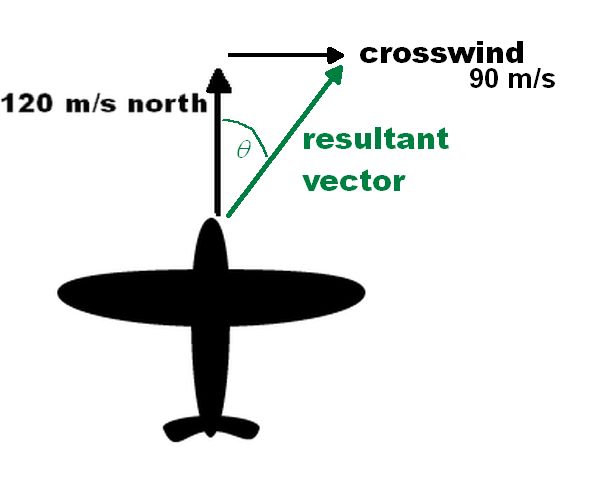
The size of this vector can be worked out using Pythagoras
Therefore the plane is travelling at a speed of 150 m/s
To work out the direction we use trigonometry.
Remember SOH CAH TOA.
From the diagram above this results in the following relationship
tan (θ)= 90/120
θ = tan-1(90/120)
θ = 37°
The resultant vector is therefore 150 m/s on a bearing of 037°
Graphically Resolved
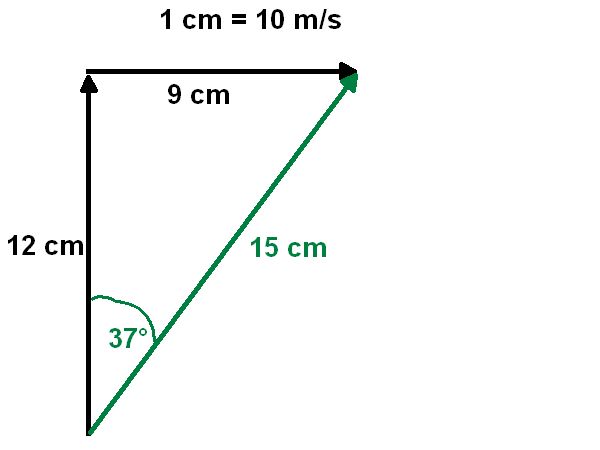
The other way to solve this problem is to draw a scale diagram.
Remember to draw the two vectors head to tail, and indicate the scale that is being used. Very often students forget to write their scale down!
In the diagram below you can see a scale diagram. The angle has to be measured with a protractor.
Calculations
In this section we will look at some past paper questions involving:
A car is travelling at 15 m/s along a 3 km strech of road. How long will it take to travel the 3km?
We have been given v = 15 m/s and (there is no direction given so this is distance, not displacement) d = 3 km = 3 x 10³ m, t = ?
Interactive example and solution
Attempt to solve the question yourself before clicking the solve button!
A cyclist rides 3000 m due east and then 4000 m due south. The cyclist takes 15 minutes to complete this distance. What is the average speed they were cycling?
We have been given d = 3000 + 4000 m and t = 15 min = 900 s, v = ?
What is the average velocity of the cyclist? To find this out we need to know the displacement and the direction of the displacement. Using pythagoras we can determine the magnitude of the displacement.
The direction can be determined using trigonometry. We will use tan (θ) since we have the adjacent and opposite sides. You should sketch a diagram to show this.
tan (θ)= 4000/3000θ = tan-1(4000/3000)
θ = 53° The direction is 53° south of east and this is a bearing of 143.
The resultant vector is therefore 5000 m on a bearing of 143
The average velocity can now be calculated
Remember the average velocity must also include the direction of the velocity
Interactive example and solution
Attempt to solve the question yourself before clicking the solve button!
Interactive example and solution
Attempt to solve the question yourself before clicking the solve button!
Experiments you must know
Average speed
In the diagram below we have the basic setup for an experiment that can be used to determine the average velocity of a cart rolling down a ramp:
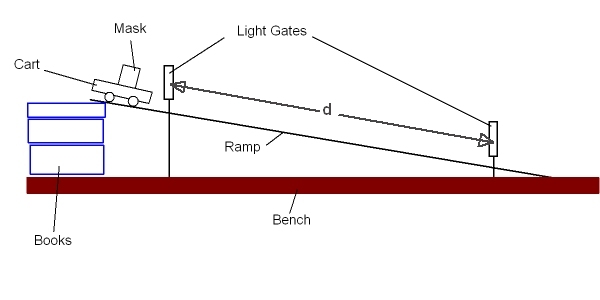
Providing we know the distance (d) between the two light gates, the datalogger will record the time it takes to plass between the two gates. With the distance and time known we can calculate the average velocity of the cart down the ramp.
The results from an experiment were recorded in the table below. The distance (d) between the light gates was 1.20 m
| Run number | Time from datalogger (s) |
|---|---|
| 1 | 1.523 |
| 2 | 1.525 |
| 3 | 1.522 |
| Average | 1.523 |
The average time from the data logger is 1.523 s. The distance travelled in that time was 1.20 m. Average speed can be determined from:
Instantaneous speed
In this experiment only one light gate is required. The width of the mask cutting the light beam of the light gate must also be accurately known. Let us use a mask that has a width of 5.00 cm. This data will be entered into the data logger. The experiment will be setup as shown in the diagram below:
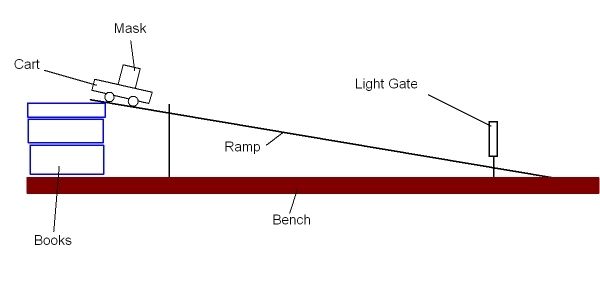
When the mask cuts the light beam, the datalogger will time how long it is blocked. With the knowledge that the card is 5.00 cm wide it will then calculate the velocity of the cart in that very short instant. Because the speed is worked out for a very tiny amount of time we call it the instantaneous velocity of the cart. The datalogger effectively carries out a d=vt calculation for a very short distance and time. The timing is much faster and more accurate than we can do with a stopwatch.
A dynamics cart with a mask passes through a light gate. The mask is 5.00 cm wide and the time taken for the mask to pass through the light gate is recorded as 0.0417 s. The speed can be calculated using:
The datalogger can normally be set to carry out the calculation and give the instantaneous velocity on its display.